March 29, 2026
ClosureLabels: Measuring Municipal Service Resolution
An assessment of whether closed municipal service requests remain resolved, using two years of 311 data from a single city.
ClosureLabels examines a single question in a large public dataset: when a city marks a service request as closed, did the reported condition actually cease? Cities routinely publish closure rates, but rarely report whether those closures hold over time. This project estimates that second quantity using open data alone and identifies the point at which the measurement is no longer valid.
The analysis uses New York City’s 311 service-request records, covering two complete calendar years. Only closed requests are included. Each closed request contains resolution text describing the agency’s stated outcome. Because this text is highly templated, a few hundred distinct strings account for nearly all records; each string is manually classified into a single outcome category. Recurrence is then measured at the same location. A request that recurs within 90 days is treated as evidence that the reported condition was not durably resolved — it was closed and subsequently returned. All reported figures are computed live from the cached data extract.
Metrics and Method
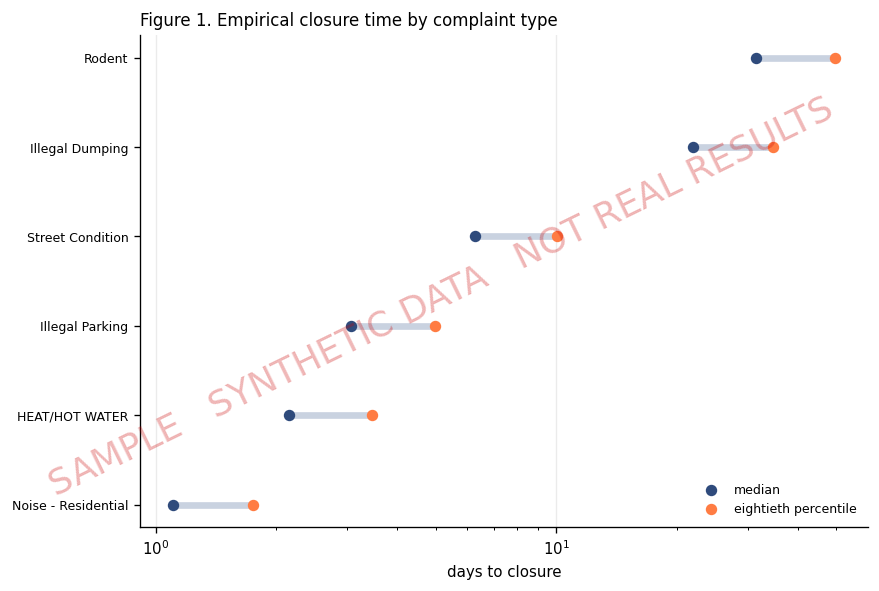
Three measures form the basis of the analysis. The first is an empirical service level. For each complaint type, the notebook reports the median, 80th percentile, and 90th percentile of time to closure, providing a direct estimate of the distribution of resolution times. This is the measure proposed by the Los Angeles Controller but not implemented.
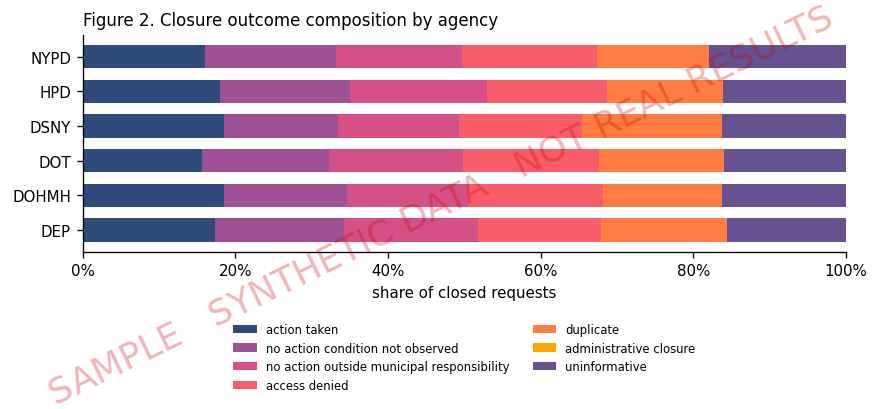
The second is a closure taxonomy derived from resolution text. Each templated resolution string is assigned to one of seven outcome categories, ranging from documented action taken to no action because the condition was not observed, as well as a purely administrative closure. The informative closure rate is the share of closures whose resolution text specifies what actually occurred.
The third measure is recurrence. For each closed request, the analysis identifies the first subsequent request of the same type at the same location and records whether it occurred within 30, 60, or 90 days.
Results
The distribution of closure times is compressed at the median and extended in the tail. Water System requests close at a median of roughly seven hours and Street Condition requests within about one day, while requests concerning damaged or dying trees show a median near twenty days and a 90th percentile beyond 260 days. A summary based on the median alone would therefore overstate responsiveness; the tail is where extended waits are concentrated. The analysis also evaluates the quality of the closure documentation. The informative closure rate is 93.4 percent, meaning that only the remaining 6.6 percent of closures contain resolution language that does not document a specific outcome. An earlier analysis of this dataset found that nearly half of one agency’s closures in a single year were ambiguous; measured directly across the full corpus, documented outcomes are substantially more common than that estimate suggests. The informative closure rate is reported by agency.
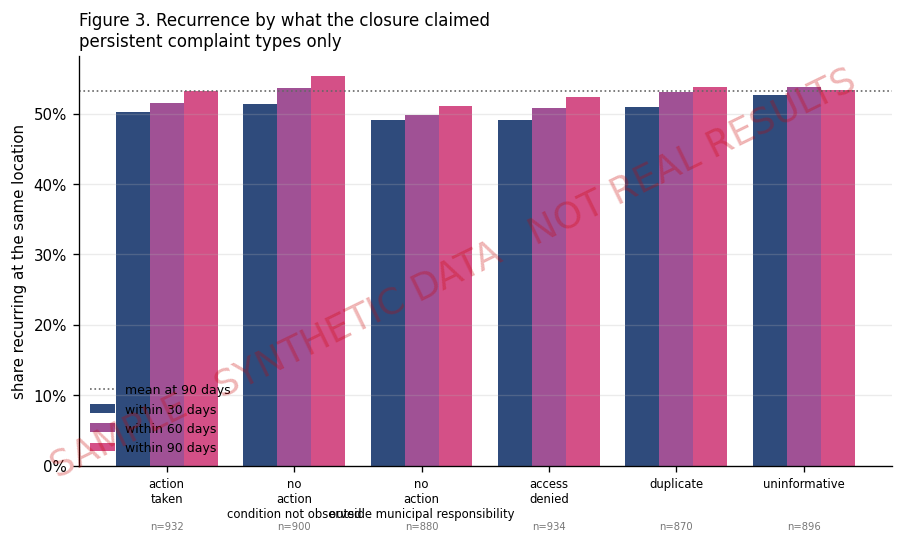
The decisive comparison relates recurrence to the outcome recorded at closure. If requests classified as resolved recur at the same rate as requests for which no action was recorded, the closure classification provides little information, and performance measures based on it may reflect administrative processing rather than substantive resolution. The notebook therefore groups recurrence rates by closure outcome and examines the variation across categories: a wide separation indicates that the closure classification carries meaningful information, while a narrow separation suggests that the classification has limited explanatory value and that reported closure rates may measure administrative completion rather than durable resolution. This interpretation applies only to complaint types involving persistent physical conditions. A pothole that recurs at the same location may indicate that the underlying condition was not resolved, whereas a recurring noise complaint may represent a new episode rather than a persistent unresolved condition. The notebook identifies eligible complaint types empirically and retains episodic complaint types as controls, providing a basis for interpreting the recurrence results.
In this dataset, the separation is wide. Recurrence within 90 days spans 45 points across closure categories, from 26.6 percent for administrative closures to 71.9 percent for duplicates, so the recorded outcome does carry information about persistence. The ordering, however, is not the reassuring one. Requests closed as action taken recur at the same location within 90 days 52.4 percent of the time — more often than requests closed because no condition was observed, at 42.0 percent. The only categories with higher recurrence are the two that concede the matter was unfinished: access denied, at 62.8 percent, and duplicate, at 71.9 percent. Two considerations qualify this result. Recurrence cannot distinguish a repair that failed from a location that is chronically affected, and the persistent set is weighted toward heat and unsanitary conditions concentrated in buildings with repeated episodes. Much of the observed recurrence therefore reflects locations cycling through the system rather than individual repairs failing — which relocates the finding rather than weakening it: closing the ticket does not interrupt the cycle.
Scope and Limitations
This is a probe, not a verdict. It is based on a single city and a single observation window, so the results should be treated as indicative rather than definitive. Resolution text was labeled by a single annotator, leaving no measure of inter-annotator agreement. Location matching is also imperfect: intersection- and block-level reports do not consistently map to address-level reports, and the notebook reports resolution rates separately by matching method. The most important limitation is that a service request is not equivalent to an incident. Reporting rates vary across neighborhoods, and prior research indicates that higher-income areas tend to generate service requests at systematically higher rates. A low recurrence rate may therefore reflect either successful resolution or a reduction in subsequent reporting. No causal claims are made. The analysis does not establish that any department failed to resolve a condition; it evaluates whether the recorded closure outcome predicts whether the reported condition persists.
Availability and Reproducibility
This project is an analysis notebook rather than a deployed application, so there is no live demo to launch. The source data are cached locally, allowing every figure and reported statistic to be reproduced from a single file. The complete notebook runs in minutes on any machine with Python. The rendered version linked above presents each figure and reported value alongside the code used to generate it.
Toward Prevention
The audit is the first step; the next is prevention. Because recurrence can be measured independently of the recorded closure outcome, the more useful problem becomes identifying which closed requests are most likely to recur. That creates an early-warning queue for potential redispatch rather than another channel for complaints. The relatively small set of locations that generate repeated requests over multiple years may represent the most promising targets for preventive investment. However, this approach carries an important constraint: any targeting system based on complaint volume inherits the reporting biases identified in this analysis. A preventive model would therefore need to account for differences in reporting propensity before informing resource allocation and should function as a screening tool for human inspection, not a substitute for it.
Receipts
- Scope 3.5 million closed 311 requests across 16 complaint types over two years.
- Result 93.4 percent of closures document an outcome, while 90-day recurrence reaches 50.9 percent for persistent conditions.
- Finding Recurrence is highest when closures report action taken, at 52.4 percent versus 42.0 percent when no condition was observed.
- Method Resolution text was hand-classified into seven outcome categories with 99 percent coverage, and recurrence was defined as a same-type, same-location request within 90 days.
- Limits Results come from one annotator and one city, with uncorrected reporting bias and recurrence interpreted only for persistent physical conditions.